

We’ve compiled some incidence, prevalence and growth estimates for selected autoimmune diseases (AIIDs) as a follow up to our previous post. In that post, we surveyed the sorry state of US national autoimmune incidence & prevalence data. Summary: Per the May 2022 NIH Report: Enhancing Autoimmune Research the US has NEVER collected or aggregated autoimmune data. In contrast, the National Cancer Institute (founded 1937!) collects national cancer data and aggregates total cancer statistics here CDC site. For more than a decade, we have been seeking robust data on incidence, prevalence & growth for autoimmune diseases. In the absence of solid national data, we’ve done our own research and share some of it here.
First, some definitions:
- Incidence = new cases diagnosed in a specified time period (usually annual). For example, the US incidence of lung cancer in 2019 was 52/100,000/year.
- Prevalence = the number of patients living with a diagnosis, either at a point in time or averaged over a specified period. US lung cancer prevalence in 2019 was 576,924 (57/100,000). Prevalence is cumulative = incidence – deaths.
- Incidence growth is a better measure of new cases because prevalence can grow through longer survival even if incidence is flat. However, since incidence is a measure of diagnoses, if there are many undiagnosed patients (as in AIIDs), incidence underestimates true disease frequency. As diagnosis improves, incidence will increase even with a flat true disease rate.
Despite these confounders, all agree that most AIIDs are increasing in real incidence & prevalence and are expected to keep growing. Since the US has NEVER collected autoimmune data, historical incidence, prevalence and growth data are missing. What data there are comes mostly from disease advocacy groups. The Autoimmune Association (previously AARDA) and Autoimmune Registry (AIR) have corralled data to make estimates across 100+ diseases. Many individual disease organizations also collect or estimate data. However, like everything autoimmune, these efforts are siloed & piecemeal.
Growing incidence & prevalence of 4 marquee autoimmune diseases: AS. IBD, MS, SLE

Inflammatory Bowel Disease (IBD). Lupus (SLE), Multiple Sclerosis (MS) & Spondyloarthritis (SA).
- Some of the apparent growth is likely better diagnosis, e.g., SLE incidence was not zero in 1970, because lupus has been known as an autoimmune disease since 1948. Moreover, one of us knew a patient who was diagnosed in ‘73!
- This is also true for axial spondyloarthritis (AS) where the length of time to diagnosis has shortened, increasing incidence and prevalence.
- Similarly, we expect diagnosis of IBD (Crohn’s & Ulcerative Colitis) has improved in the last 50 years. IBDs were not widely recognized as autoimmune diseases until the 1990s.
- Even multiple sclerosis (MS) is more widely recognized than in 1970 (when one of us met an MS patient for the first time), especially milder forms of the disease.
It is also likely that patients are living longer with these diagnoses. That alone will increase prevalence without necessarily showing an increase in incidence year over year.
Rheumatoid Arthritis incidence estimates 1955-2022

RA and SLE were the first two chronic conditions recognized as autoimmune diseases. Rheumatoid Arthritis was first distinguished from other forms of joint disease in 1800 (A. J. Landré-Beuavais). After a long series of earlier names, Alfred Garrod named it Rheumatoid Arthritis, still used today. The inflammatory form was distinguished from osteoarthritis in the 1860s. McFarlane Burnet finally characterized RA as an autoimmune disease in 1939. Incidence measures new diagnoses. Unlike the diseases in the previous chart, this one shows declining RA incidence from 1955-1985. As the slope suggests, the incidence of RA was even higher in the first half of the 20th C. Data are sparse but historical accounts suggest that RA was even more common in the 19th C.
Several population-level factors may explain this pattern:
- Before antibiotics, Streptococcus A infections (strep throat, scarlet fever, rheumatic fever) often triggered “rheumatism” (one of the old names for RA that also included SLE & inflammatory arthritides before those were teased apart).
- The early decades in this chart coincide with a massive reduction of smoking in the US population; smoking is a well-known risk factor for RA.
- But since 1985, incidence has been rising, for unknown reasons. Improved detection and diagnosis may be part of this, as well as unknown genetic changes and environmental triggers.
Type 1 diabetes incidence estimates 1920-2000

Scandinavia produces the most robust historical data on childhood diabetes (aka Type 1 or T1DM). Since the 1990s T1D is universally acknowledged as an autoimmune condition. This is a Norwegian data set. However, we see the same pattern in the US and other countries with large Northern European populations. Unlike most autoimmune diseases, even the US has done national surveillance for diabetes for several decades. Unfortunately, CDC statistics mix Type 1 and the far more common (90-95%) Type 2 (aka adult DM). Early in the 20thC, T1D was rarely diagnosed, and extremely fatal when it was. The development of insulin replacement therapy coincided with a dramatic rise in recorded cases of childhood diabetes. This is perhaps because it was no longer a rapid death sentence. That certainly increased prevalence (not shown here)!
What might be driving the increasing incidence?
- More careful detection, driven by advances in medical diagnosis and care over the decades.
- A change in population genetics after antibiotics and vaccines greatly reduced serious infectious disease burden, leading to a general rise in autoimmunity.
- Environmental factors: cows milk in infants, other dietary changes, increasing childhood obesity, and microplastic pollution have been suggested, but no studies have found smoking triggers.
The growth in incidence begins to flatten after 1980 (the inverse of RA). What could account for this?
Prevalence of Lupus, Multiple Sclerosis, Axial Spondyloarthritis, and IBD increases from 1970 to 2022, as shown in the graph above. Furthermore, we also see an increased incidence rate of Lupus and Celiac in the past 50 years. While most autoimmune diseases are increasing, not all are. Rheumatoid Arthritis has shown a decreased prevalence in the past decades.
Despite the general increase in autoimmune disease, we have no standardized research on autoimmune disease incidence and prevalence data. The true number of autoimmune disease patients is likely much higher than the AARDA estimate, and growing.
So, what IS the total US prevalence of autoimmune disease?
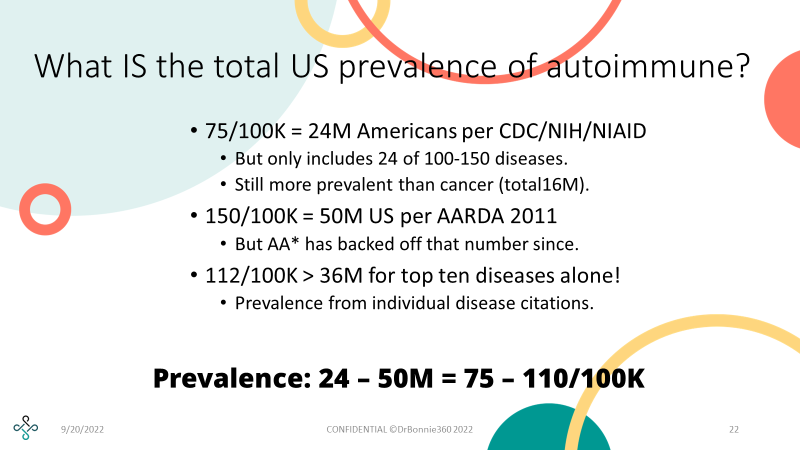
In conclusion, the usually cited statistics are missing or piecemeal, outdated (1997) and much too low!
We conclude that autoimmune diseases are an enormous, invisible and expensive chronic disease epidemic. This category is much larger than cancer, heart disease or type 2 diabetes. Nevertheless, those categories have attracted much more attention from the NIH, CDC, investors and emerging digital health companies. Therefore, AIID represents a huge unmet need and barely tapped market opportunity.
Authors: DrBonnie360, Ellen M Martin & Emily Burns
We approach these thought leadership posts from our multi-lens perspectives.
- DrBonnie360: Digital health consultant, clinical dentist, Wall Street analyst, patient & advocate.
- Ellen M Martin: Consultant, writer & editor, life science finance/investor relations/marketing communications, autoimmune caretaker.
- Emily Burns: Digital health equity research intern, Public health associate with the Centers for Disease Control and Prevention.
Strategic Consulting & Professional Services
We provide professional consulting services to investment, emerging and established companies. We bridge silos and fill gaps to help our clients improve healthcare and reduce costs for AIID patients. Informed by patient and caretaker perspectives, we urge investors & clients to integrate the best of digital, conventional and functional medicine.
- We help our clients leverage digital innovations into V1C for AIID patients.
- Our subject matter expertise includes: oral health, microbiome, autoimmune patient journeys, competitive landscape analysis, strategic positioning & messaging, digital health, and self-hacking.
- We have decades of experience in finance, marketing and communications for dozens of healthcare and life sciences organizations, emerging and established.
- Our backgrounds include clinical dentistry, osteology, biotech IR/PR, marcomm, content creation, strategic consulting, and autoimmune advocacy.
Contact us to help you map your market landscape and understand patients unmet needs. We also can help you clarify and articulate your company’s market position and differentiators. Long before COVID-19, we were facilitating virtual sessions. We also create compelling content: articles, blog posts, collateral, e-books, web copy and white papers. Our Autoimmune Connect/DrBonnie360 website showcases our own content.


2 Comments
Cost Burden of the Autoimmune Epidemic – Autoimmune Connect · March 22, 2023 at 7:34 pm
[…] incidence & prevalence (number of patients), increasing diagnosis & treatment raise all cost […]
Specialty Drugs Raise Autoimmune Costs – Autoimmune Connect · June 15, 2023 at 7:10 pm
[…] in the autoimmune patient population (disease […]